Many manufacturing organizations rely on continuous improvement activities to maintain their competitive position. Effective communication is seen as a key factor in facilitating the alignment of continuous improvement efforts with the organization’s strategy. More and more organizations are working to ensure effective internal communications due to time pressures and the need to continuously employ strategic information. Visual management provides the appropriate means to support the effective transfer of information [1]. Visual management is closely linked to continuous improvement, as it is concerned with providing a shared vision of what needs to be improved and how improvements should be implemented [2]. Visual management, as an internal element of Kaizen, helps make problems visible to everyone during work, so that corrective actions can be taken in real time, thus reducing the chances of similar problems appearing in the future. [3]

To explain the previous idea more clearly, it can be said that in every system there are three basic groups of flows: (material flow, information flow, cash flow), and here visual management is considered the best tool for dealing with the flow of information in the workplace[4]; as companies have to deal – in real time – more and more with emergency situations and make exceptional decisions in the shortest time periods in both strategic and operational areas, and accordingly, the ability to transform information into negotiating power and speed of decision-making are critical factors for success. In this context, it has become clear that visual display or data visualization and immediately accessible aggregate information are of great importance as they help represent complex cases and relevant multidimensional data sets and present them in a simple and tangible form for decision makers, and real-time access to all data and information related to the project allows for early detection of risks, which reduces the need to perform frequent troubleshooting and repair activities.[5]

It can be said that the use of visual elements for communication between humans began at least with the first ancient human drawings on cave walls, and today, thanks to the information technology revolution, the possibilities of depicting content have been improved through computer-driven technology[6].
Historical development of visual management
Researchers have summarized the historical development of visual management as follows: In 2500 BC, the royal stick was widely used in ancient Egypt in construction projects and other related fields as a standard for visual measurement. In 600 BC, the Chinese general Sun Tzu used gongs, flags, and flame signals to manage and communicate with his army. In the period 1800-1813, Robert Owen (a pioneering figure) used simple forms of fixed visual guides to manage workers. In 1917, the Gantt chart, invented by Henry Gantt, was applied to use as a visual control tool for production at the U.S. Army’s Frankford Arsenal munitions plant. In 1920, Charles Edward Knebel used visual control devices to establish links between industrial efficiency and graphic methods. In 1932, Alan Mogensen called for process planning (mapping) and operator participation to simplify work. In 1935, the first manuals were developed on the concept of just-in-time (JIT) production – which Visual management is part of it – by the founder of Toyota (Kichiro Toyoda), and in 1937, visual worksheets were used at Toyota, which showed the work cycle, work sequence and standard inventory, and from the mid-1940s to the 1970s, the development of the practice of visual management can be observed within the Toyota production system. In the late 1940s, manuals and standard operating procedures were posted above work stations, which helped supervisors quickly know whether workers were following work instructions. In 1953, Toyota implemented the production control and synchronization system (Kanban) in its main sales center, and in the same year (Kaoru Ishikawa) used the Ishikawa diagram (fishbone or cause and effect) for the first time; Ishikawa pointed out that 95% of quality problems could be solved using the seven basic visual tools (the old seven quality tools). From the mid-1950s to the early 1980s, many aspects of workplace structure, visual control and housekeeping, or what is known today as the (5S) system, were developed in Japan. In 1957, Toyota began using the quality control system (andon) or light board. In 1961, Shigeo Shingo implemented the first error-checking device (poka-yoke) at the Yamada Electric plant. In 1977, researchers and managers at Toyota published the first papers in English on the Toyota Production System, which included the uses of visual management in operational and administrative processes. [7]

Visual management concept
Visual management principles have been widely applied and proven to be highly effective[8]; visual management has been developed and used effectively in many manufacturing and service organizations for a long time[9], and the use of visual tools has been documented in many different sectors such as: aviation and aerospace, healthcare, government[10] and construction. Researchers have used many terms or names to refer to this concept, all of which refer to close meanings. For example, the terms: visual management, visual workplace, visual control, visual factory, shop floor management, visual tools, and visual communication[11] have been used.
Visualization or visual management has been seen as a powerful tool to help detect deviations in the process, and thus show the positive or negative results of performance in the work environment; any manager or supervisor – even outside his work area – can use visual management to quickly detect any deviations from the established standards, and then take corrective action. Accordingly, visual management is a clear strategy for dealing with delayed responses resulting from performance deterioration and process deviations [12]. Here, visual management can be used in two ways: [13]
-The first method is to use it as an informative tool; many tools are used here, such as process mapping tools, workplace names, and other examples.
-The second approach is to use visual management as a directive tool where requirements are displayed and visualized and directions are set, examples of which are traffic lights, crosswalk signs, evacuation alarms, Kanban cards, standard work instructions, Andon boards, etc.
From the above, it is clear that visual management has a supporting role in other administrative practices. The relationship between visual management and other administrative practices can be explained in the following figure:

Visual management can also serve a wide range of functions within an organization, especially at the operational level, including: transparency, discipline, continuous improvement, job facilitation, workplace training, creating shared ownership, managing by facts, simplification, and standardization.[14]
Visual management elements
Visual management is a practice used to drive continuous improvement contributions; it involves many tools that can be used primarily to visualize information, which leads to a better understanding of related processes and places, as well as to communicate requirements and manage tasks efficiently and effectively, which leads to communicating current metrics, goals and performance indicators in a simple and accessible way for everyone, which in turn allows information to flow efficiently and effectively. Examples of these tools include: Value Stream Maps (VSM), flow charts, place name plates, traffic lights and signals, evacuation alerts, Kanban cards, Andon boards[15]. It can be said that there are many different approaches to employing visual management tools to achieve multiple goals in various environments.[16]
Visual control, the researchers noted, is any communication device used in a work environment that quickly tells us how work is being done and whether it is up to standards. It helps workers recognize how to do a job well, shows us where items belong, how many items are there, what the appropriate standard is for doing something, the current status of work, and many other important information related to workflow activities. The Toyota Way considers visual management to be a complementary element to humans because we are visually, auditorily and tactilely (sensory) oriented, and the best visual indicators are those in the workplace that appear to us quickly and clearly indicate to us through sound, sight and feeling the standard and any deviation from the standard. Accordingly, the visual control system helps increase productivity, reduce defects and errors, meet deadlines, facilitate communication, improve safety, reduce costs and give workers more control over their environment [17]. Visual controls are simple signals that provide an immediate and clear understanding of a specific condition or situation. They allow anyone to enter the workplace and know what is happening within a short period of time (usually 30 seconds) in terms of the production schedule, accumulation, workflow, inventory levels, resource utilization and quality. Therefore, they are effective, self-organizing and worker-managed elements and include: kanban cards, lights, color-coding tools, lines that define work areas and product flow, etc. [18]
After reviewing a number of previous studies, the researcher reached the most elements and concepts mentioned by the studies related to visual management, which are: signs on the work floor, key performance indicators (KPIs), production analysis boards (PAB), communication boards, colored tags, display boards in general (workplace names, directions, warnings, etc.), modern display screens (electronic or digital), information technology means (computers, tablets, mobile phones, Internet of Things, etc.), the seven old and new tools for quality, lights (Andons), project boards, Kanban cards. The following is a brief explanation of some of the previous concepts:
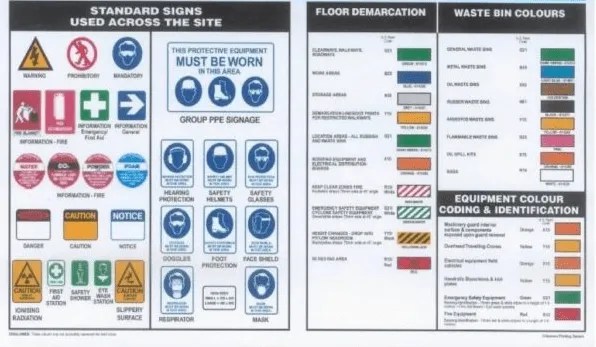
Markings on the work floor: They are continuous or broken lines or multi-colored geometric shapes used in workplaces to clarify many things such as: paths (workflow, product, workers, building evacuation signs, etc.), places to place and arrange things whether for immediate or later use or places to store things, signs used in matters related to safety such as dangerous places and others.
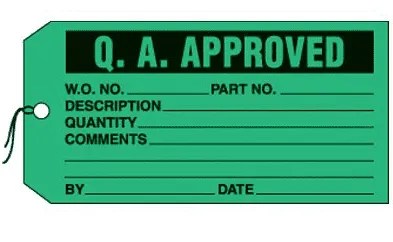
-Colored tags: They come in many shapes, sizes and colors, and can be written on; they are used to perform many tasks, including: clarifying the importance of materials and the priority of their use, classifying materials, and then isolating them and getting rid of unnecessary materials, safety and warning labels, work-related labels such as clarifying holidays, production flow, downtime, etc. These labels can be placed directly on products, on boxes, in different workplaces, on different boards, etc.
-Reflective mirror: The following figure shows the use of a three-part mirror that reflects the front and sides at the same time:
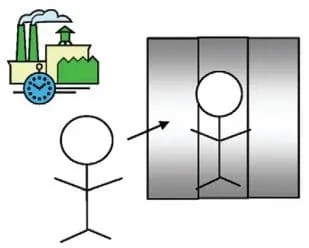
Here, using this mirror, the worker can ensure that he is ready for work by standing in front of this mirror, then removing any dust from his work clothes, as well as ensuring his physical and mental condition. This tool helps maintain and improve the levels of key performance indicators related to safety, quality, and morale.[19]
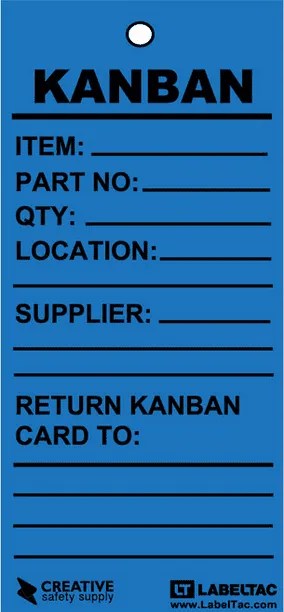
-Kanban cards: In their simple concept, they are a method for maintaining the order of the flow of materials. Kanban cards are used to determine the point of requesting materials, the quantity of materials required, and the source and destination of delivery of these materials[20].
-Andon lights: In its simple concept, they are light signals that consist of either a single light of one color or several lights of different colors arranged together so that each color represents a specific condition. This tool helps maintain and improve the levels of key performance indicators related to productivity, cost and delivery. As for the single light case, it consists of two stages, where the light is turned on in the event of any problem in the production line. Here, the line manager checks the condition of the production line and corrects the error, after which the light is turned off[21]. As for the second case, the following figure shows an example of Andon lights:
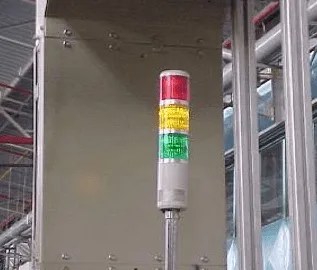
These lights have been used effectively in the world’s most powerful organizations in a wide range of fields such as aviation and space (Boeing, Airbus, Lockheed Martin). Today, more advanced display tools are used to represent the Andon system based on information technology and the Internet of Things.
-Boards: The names and objectives of these boards varied in previous studies; they were referred to under the names: visual boards, communication boards, key performance indicator boards (KPIs boards), production analysis boards (PAB), workplaces name boards, project boards, direction or warning boards, and other names. Regardless of the different names of the boards, they serve common purposes.
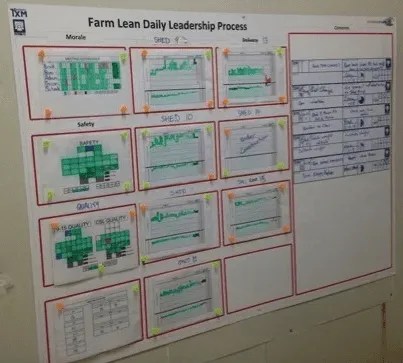
Visual management and communication boards are an attractive path for organizations that want to engage their teams and first-line managers in joint discussions and problem solving [22]. The goal of visual boards is to display all manufacturing KPIs. Here, the boards should be easily accessible, responsive, and display KPIs in a quick and easy-to-understand manner. Here, too, display technologies that can be easily programmed to display colorful and eye-catching displays can be used. Collecting and processing data helps organizations gain higher levels of control over production resources, which can positively impact all sub-processes within the organization. The use of visual management tools positively impacts the effectiveness of time, cost, quality, and waste by creating a more transparent and information-rich environment [23]. Communication boards are also commonly used in flexible environments to assist team decision-making by displaying up-to-date and relevant information. [24] In their simplest form, display boards can be a whiteboard on which writing, colored stickers, written papers, charts, tables, etc. are placed. They can also be electronic boards that use lights for display. Display boards have evolved in their various forms with the introduction of modern means of information and communication technology; many organizations today use advanced displays (digital) that display information in high resolution and with advanced display technologies (some of which are three-dimensional), in addition to the use of computers, tablets, mobile phones, Internet of Things concepts, etc.
References
The primary source of the article is: Al-Farhan, Mohannad. (2022). The role of continuous improvement technique on organizational learning process: An applied study on the electrical appliances manufacturing sector. Master’s thesis, Faculty of Commerce – Menoufia University. / The thesis can be obtained by clicking here.
[1] Olszewski, L. et al. (2019). Exploring Visual Management and Continuous Improvement in a Manufacturing Context: A Structured Bibliometric Analysis. 23rd Cambridge International Manufacturing Symposium, p1.
[2] Bateman, N. et al. (2012). Visual Management and Shop floor Teams – Utilizing Shop floor Knowledge. In EUROMA, Gothenburg. Industry Forum, p2.
[3] Singh, J. and. Singh, H. (2013). OPCIT, p89.
[4] Eaidgah, Y. et al. (2015). OPCIT, p204.
[5] Spath, D. et al. (2005). Visual management. In: Kuhlin B., Thielmann H. (eds) The Practical Real-Time Enterprise. Springer, Berlin, Heidelberg, p321-327.
[6] Lindlof, L. (2014). Visual Management – on Communication in Product Development Organizations. PhD thesis, Chalmers university of technology, p6-7.
[7] Tezel, A. et al. (2009a). “The Functions of Visual Management”, In Proceedings of the International Research Symposium, Salford, UK, p2-3.(Quoting from many sources)
[8] Bateman, N. et al. (2012). OPCIT, p10.
[9] Tezel, A. et al. (2009b). Visual management – A general overview. Fifth International Conference on Construction in the 21st Century (CITC-V) “Collaboration and Integration in Engineering, Management and Technology”, p1.
[10] Bateman, N. et al. (2016).Visual management and shop floor teams – development, implementation and use. International Journal of Production Research, 54(24), p1.
[11] Tezel, A. et al. (2009a). OPCIT, p2.
[12] Larteb, Y. et al. (2016). The Key to Lean Performance: Implementing A Daily ShopFloor Control System Using Standardization and Visual Management. International Journal of Advanced Research in Management, 7(1), p40.
[13] Eaidgah, Y. et al. (2015). OPCIT, p191.
[14] Tezel, A. et al. (2009b). OPCIT, p2-3.
[15] Eaidgah, Y. et al. (2015). OPCIT, p188.
[16] Niemi, E. (2015). Lean project management: Visual management tools. Bachelor’s thesis – HAME university of applied sciences, p8.
[17] Liker, J. (2004). The Toyota Way: 14 management principle from the world’s greatest manufacturer. McGraw-Hill, p167-172.
[18] Kilpatrick, J. (2003). Lean principles. Utah Manufacturing Extension Partnership, p3.
[19] Murata, K. and. Katayama, H. (2010). Development of Kaizen case-base for effective technology transfer–a case of visual management technology. International Journal of Production Research, 48(16), 4908-4909.
[20] Kilpatrick, J. (2003). OPCIT, p2.
[21] Murata, K. and. Katayama, H. (2010). OPCIT, 4909-4910.
[22] Bateman, N. et al. (2016).OPCIT, p19.
[23] Steenkamp, L. et al. (2017). Visual management system to manage manufacturing resources. Procedia Manufacturing 8, p460.
[24] Bateman, N. et al. (2012). OPCIT, p1.


Subscribe to get the latest blogs
*-please check the spam folder if you didn’t receive the email